From data-rich to data-driven.
The Noll Team had built twenty years of records, a CRM full of relationships, and tracking kept faithfully every week. Nobody's job was to turn any of it into a system. I spent eight months building one, a piece at a time.
A data-rich business with no defined way to use what it had.
The role had no template, so I found the work in a loop. Look for what was breaking or what leadership wished they could do and couldn't, build it with whoever owned that part of the business, then bring back what I found, which almost always turned up the next thing worth doing.
Where the work reached
The role started in the weekly reporting. It did not stay there.
AI AND BUSINESS STRATEGY INTERN
Executive reporting
Performance review became a standing cycle instead of an ad hoc conversation, and leadership reads the numbers without asking anyone for them.
Back-office operations
Weekly tracking stopped being somebody's manual chore, and ownership went back to the office rather than staying with me.
Field performance
Nine agents kept their numbers nine different ways. Now they sit side by side, and relationship activity is something leadership can hold people to.
Voice of the client
Six years of client feedback nobody had read end to end now reaches the CEO as coaching material, agent by agent.
Segment strategy
Twenty years of transactions showed how much of the revenue sat in a thin slice at the top, and that finding went into the decision to launch Noll Reserve.
Service line economics
Noll Team Interiors got a case for what staging is worth, made out of the team's own closings rather than an industry statistic.
What sat underneath
Six places on the map, but not six separate builds. Each one was built on the last: the tracking sheet fed the reporting, the reporting became the dashboard's per-agent view, and the sharper questions came out of all of it.
Google Sheets · Excel
The data underneath
The weekly tracking came first. I linked the tabs, wrote the calculation logic, and pointed the whole thing at the Buffini and MLS feeds, then checked every output against numbers the team already trusted. The same job sat under everything else. Nine people kept their records their own way, so I standardized them before I could compare anything.
Excel · Python · Power BI
Making performance visible
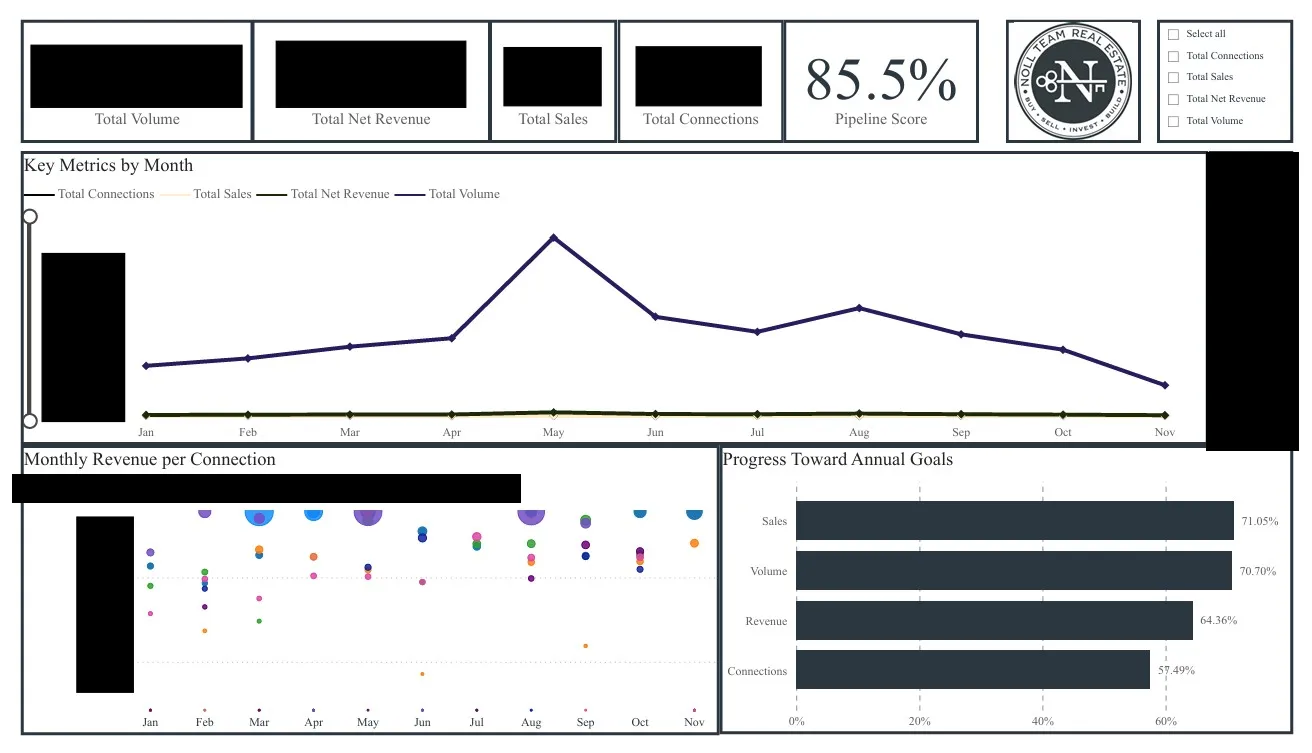
I built the review structure once, covering KPIs, connections, GCI, and pipeline, then ran it across all nine agents. The Power BI system came later, and nobody asked for it. Power Query feeds a star-schema model, DAX handles the measures, and the report holds a KPI header, a monthly trend, and a per-agent bubble plot behind one filter. The goal and pipeline measures show up exactly as the team already kept them. I surfaced those, I did not redesign them.
Python · LLM workflow
Turning it into answers
I standardized connection and revenue records by agent and period, pulled both to the same grain, and worked out what that activity produced in income, for each agent and for the team. The reporting environment covered tens of thousands of client connections a year, more than two hundred home sales as a team, and tens of millions in volume, which is the scale the team was already operating at and had no connected way to read. The surveys were a separate build. An LLM workflow read four hundred PDFs, pulled out recurring themes and sentiment, and sorted the findings by agent, and I wrote the process down so someone else can run it.
The more I showed people what their own numbers could do, the more questions came back the other way. Two of them became projects.
31%
OF REVENUE, FROM 11% OF SALES
Should luxury be its own business?
Brad asked. I segmented twenty years of transaction history against the $500K Fort Wayne benchmark and worked out what share of sales and revenue sat above it. Noll Reserve launched not long after, and the new brand took one of Fort Wayne's highest-priced estates to market and closed it.
9 days
TO SALE, AGAINST 38
Does staging change a sale?
Noll Team Interiors asked. I compared twelve closings across three zip codes, staged against non-staged inside the same areas so location held roughly constant. The staged homes also closed at 100.8% of list where the others came in at 97.9%.
What outlasted it
I built the handoff in from the start, not onto the end.
STILL RUNNING
The tracking computes itself every week with nobody touching it. The Power BI report refreshes on its own, and the review structure takes any agent who joins.
WRITTEN DOWN AND RECORDED
I wrote SOPs for the workflows, documented the processes, and recorded training videos for the automations and the Power BI system, enough for the next intern to start from, a manager to look back on, or a VA to work from.
WHAT THE TEAM KEPT
Analytics and AI moved past my own desk. I presented findings to the full group, showed people where AI helped and where it did not, and worked through it with agents and virtual assistants.
If I started it today
I would build one governed source first and let every downstream analysis consume it. Each project began by finding, cleaning, and merging much of the same data again; that repetition was the cost of building the analytical layer before the foundation.
The pattern
The tools changed from project to project. The pattern did not: find where information sat trapped, make it usable, and carry the answer far enough that someone could act on it.
The work started with spreadsheets. The real job was turning information into decisions.